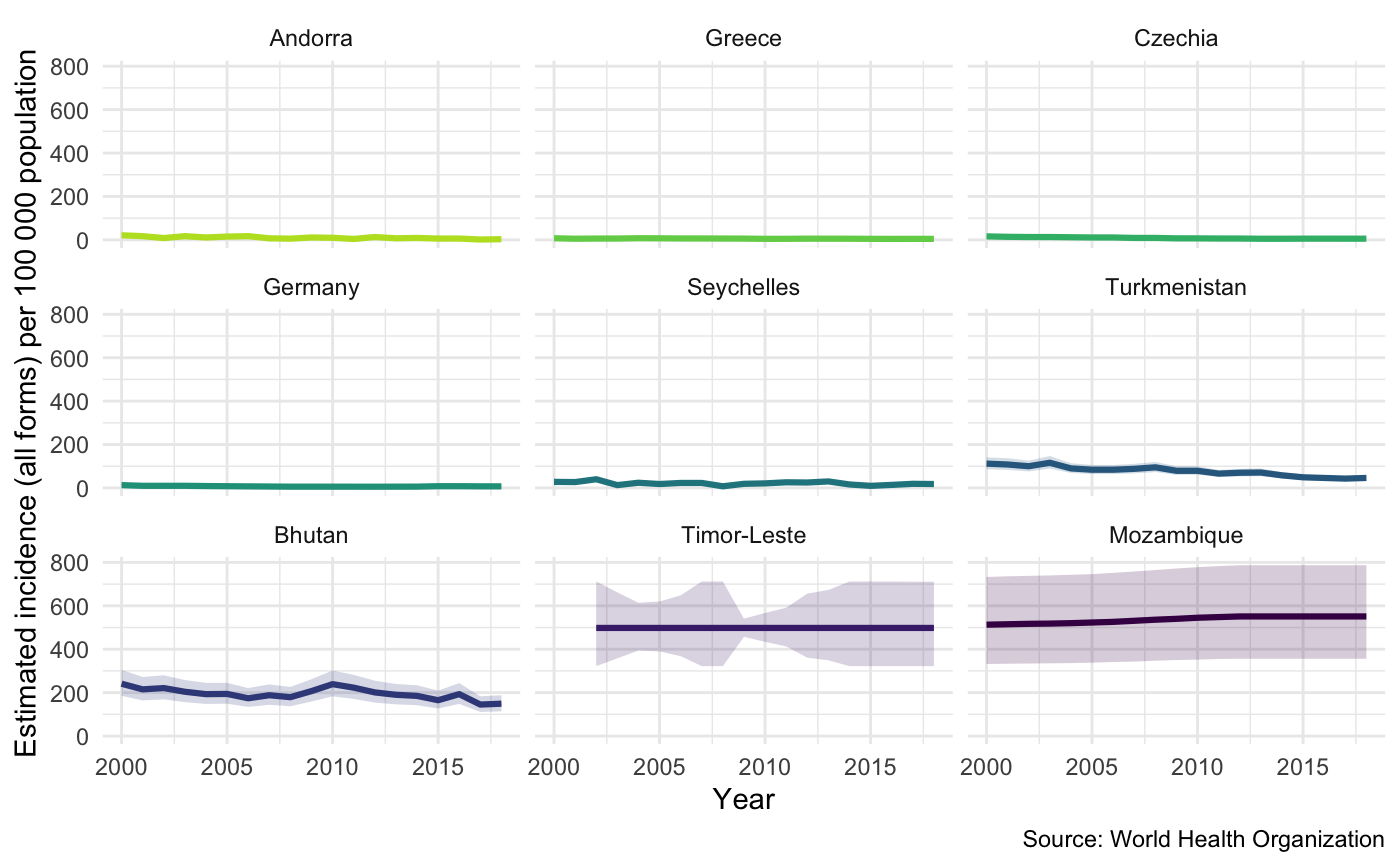
Plot measures of TB burden by country by specifying a metric from the TB burden data. Specify a country or vector of countries in order to plot them (by default plots all countries). Various other options are available for tuning the plot further.
plot_tb_burden(
  df = NULL,
  dict = NULL,
  metric = "e_inc_100k",
  metric_label = NULL,
  smooth = FALSE,
  conf = c("_lo", "_hi"),
  countries = NULL,
  years = NULL,
  compare_to_region = FALSE,
  facet = NULL,
  legend = "none",
  annual_change = FALSE,
  trans = "identity",
  scales = "fixed",
  interactive = FALSE,
  download_data = TRUE,
  save = TRUE,
  viridis_palette = "viridis",
  viridis_direction = -1,
  viridis_end = 0.9,
  verbose = FALSE,
  ...
)
Arguments
| df | Dataframe of TB burden data, as sourced by |
|---|---|
| dict | A tibble of the data dictionary. See |
| metric | Character string specifying the metric to plot |
| metric_label | Character string specifying the metric label to use. |
| smooth | Logical, defaults to |
| conf | Character vector specifying the name variations to use to specify the upper
and lower confidence intervals. Defaults to c("_lo", "_hi"), if set to |
| countries | A character string specifying the countries to target. |
| years | Numeric vector of years. Defaults to |
| compare_to_region | Logical, defaults to |
| facet | Character string, the name of the variable to facet by. |
| legend | Character string, defaults to |
| annual_change | Logical, defaults to |
| trans | A character string specifying the transform to use on the specified metric. Defaults to no
transform ("identity"). Other options include log scaling ("log") and log base 10 scaling
("log10"). For a complete list of options see |
| scales | Character string, see ?ggplot2::facet_wrap for details. Defaults to "fixed", alternatives are "free_y", "free_x", or "free". |
| interactive | Logical, defaults to |
| download_data | Logical, defaults to |
| save | Logical, should the data be saved for reuse during the current R session. Defaults to
|
| viridis_palette | Character string indicating the |
| viridis_direction | Numeric, indicating the direction for the colour palette (1 or -1), defaults to -1.
See |
| viridis_end | Numeric between 0 and 1, defaults to 0.9. The end point of the viridis scale to use.
#' See |
| verbose | Logical, defaults to |
| ... | Additional arguments to pass to |
Value
A plot of TB Incidence Rates by Country
See also
get_tb_burden search_data_dict
Examples
## Get the WHO TB burden data and the data dictionary
tb_burden <- get_tb_burden()
dict <- get_data_dict()

## Get a random sample of 9 countries
sample_countries <- sample(unique(tb_burden$country), 9)

## Plot incidence rates in these countries
plot_tb_burden(df = tb_burden, dict = dict, facet = "country", countries = sample_countries)if (FALSE) {
## Plot smoothed incidence rates in these countries
plot_tb_burden(
  df = tb_burden, dict = dict, facet = "country", smooth = TRUE,
  countries = sample_countries
)
## Use data caching to plot incidence rates with free y scales
plot_tb_burden(facet = "country", countries = sample_countries, scales = "free_y")

## Plot annual percentage change in incidence rates in selected countries
plot_tb_burden(
  df = tb_burden, dict = dict, facet = "country", scales = "free_y",
  countries = sample_countries, annual_change = TRUE, conf = NULL
)

## Find variables relating to mortality in the WHO dataset
search_data_dict(def = "mortality")
## Plot mortality rates (exc HIV) - without progress messages
plot_tb_burden(
  metric = "e_mort_exc_tbhiv_100k", facet = "country",
  countries = sample_countries, scales = "free_y"
)
}