Sam Abbott
Estimating epidemiological delay distributions for infectious diseases
I summarise our research on refining delay distribution estimates in epidemic modeling, a journey prompted by my general confusion. We explore and compare various approaches, drawing insights from simulations and Ebola virus disease outbreak data, and suggest paths for future improvements. Also featuring Poppy, the puppy, who is currently gnawing on my hand and occasionally archiving my emails.
Data, Models, and Modellers during a Global Pandemic
My notes for my points and answers as part of the Data, Models, and Modellers during a Global Pandemic discussion session at the International Indian Statistical Association 2022 meeting. Also includes the recording of my talk on our recent paper "Evaluating an epidemiologically motivated surrogate model of a multi-model ensemble" as part of the Pandemic forecasting: Lessons learnt from COVID-19 session.
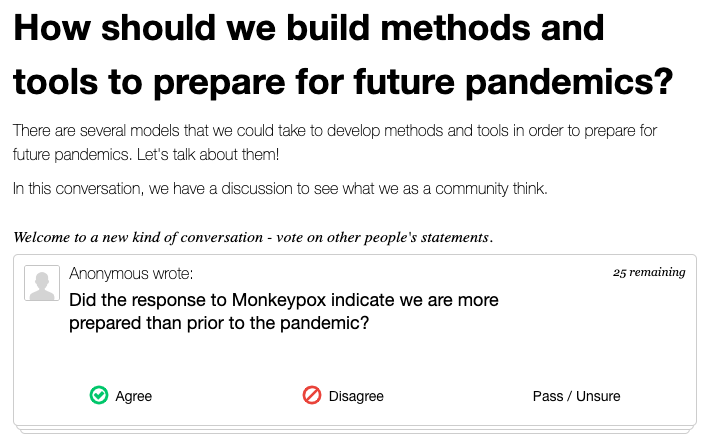
How should we build methods and tools to prepare for future pandemics?
There are several models that we could take to develop methods and tools in order to prepare for future pandemics. We should talk about them.
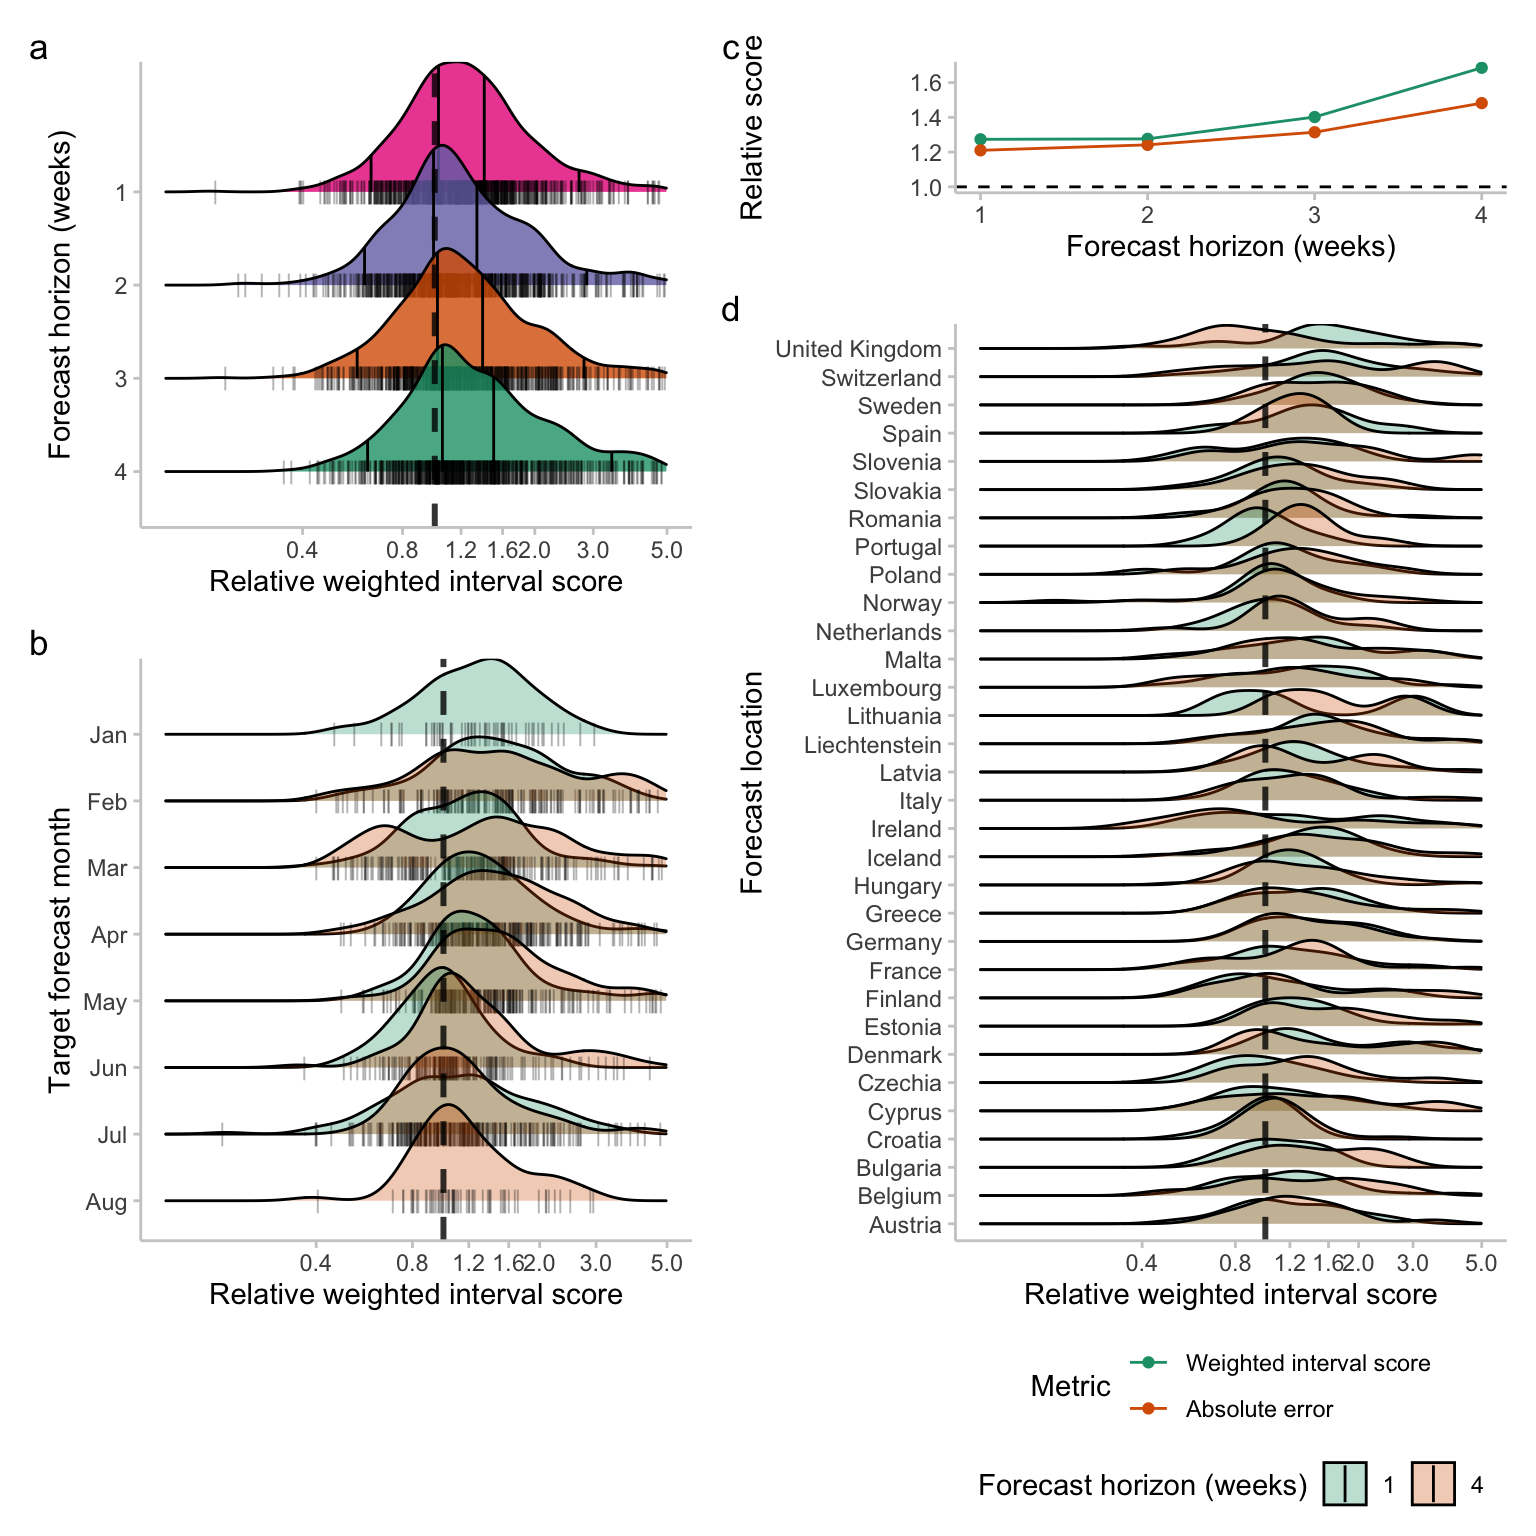
Evaluating an epidemiologically motivated surrogate model of a multi-model ensemble
Multi-model and multi-team ensemble forecasts have become widely used to generate reliable short-term forecasts. Whilst there is robust and consistent evidence that multi-team ensemble forecasts provide reliable and performant forecasts across domains they also have a range of downsides. The most significant is the difficulty in interpreting them. Here we develop a parsimonious forecast model based on observations of ensemble behaviour and evaluate its predictive performance.
What is 80% good enough for real-time infectious disease analyses?
A comment piece exploring what factors led to limitations in some of the work we produced during the COVID-19 pandemic, whether this work was good enough, and some potential ideas for improving future work of a similar kind.
My application to be an instructor with Applied Epi
The cover letter I provided as part of my application to be an instructor with the Applied Epi organisation. Contains background on the motivation for my work, details of my prior experience, and thoughts on user based software development.
A very biased view of my recent research
A very biased overview of my recent research output as written for an internal promotion application. As such take everything with a large pinch of salt and replace all the I statements with We statements.
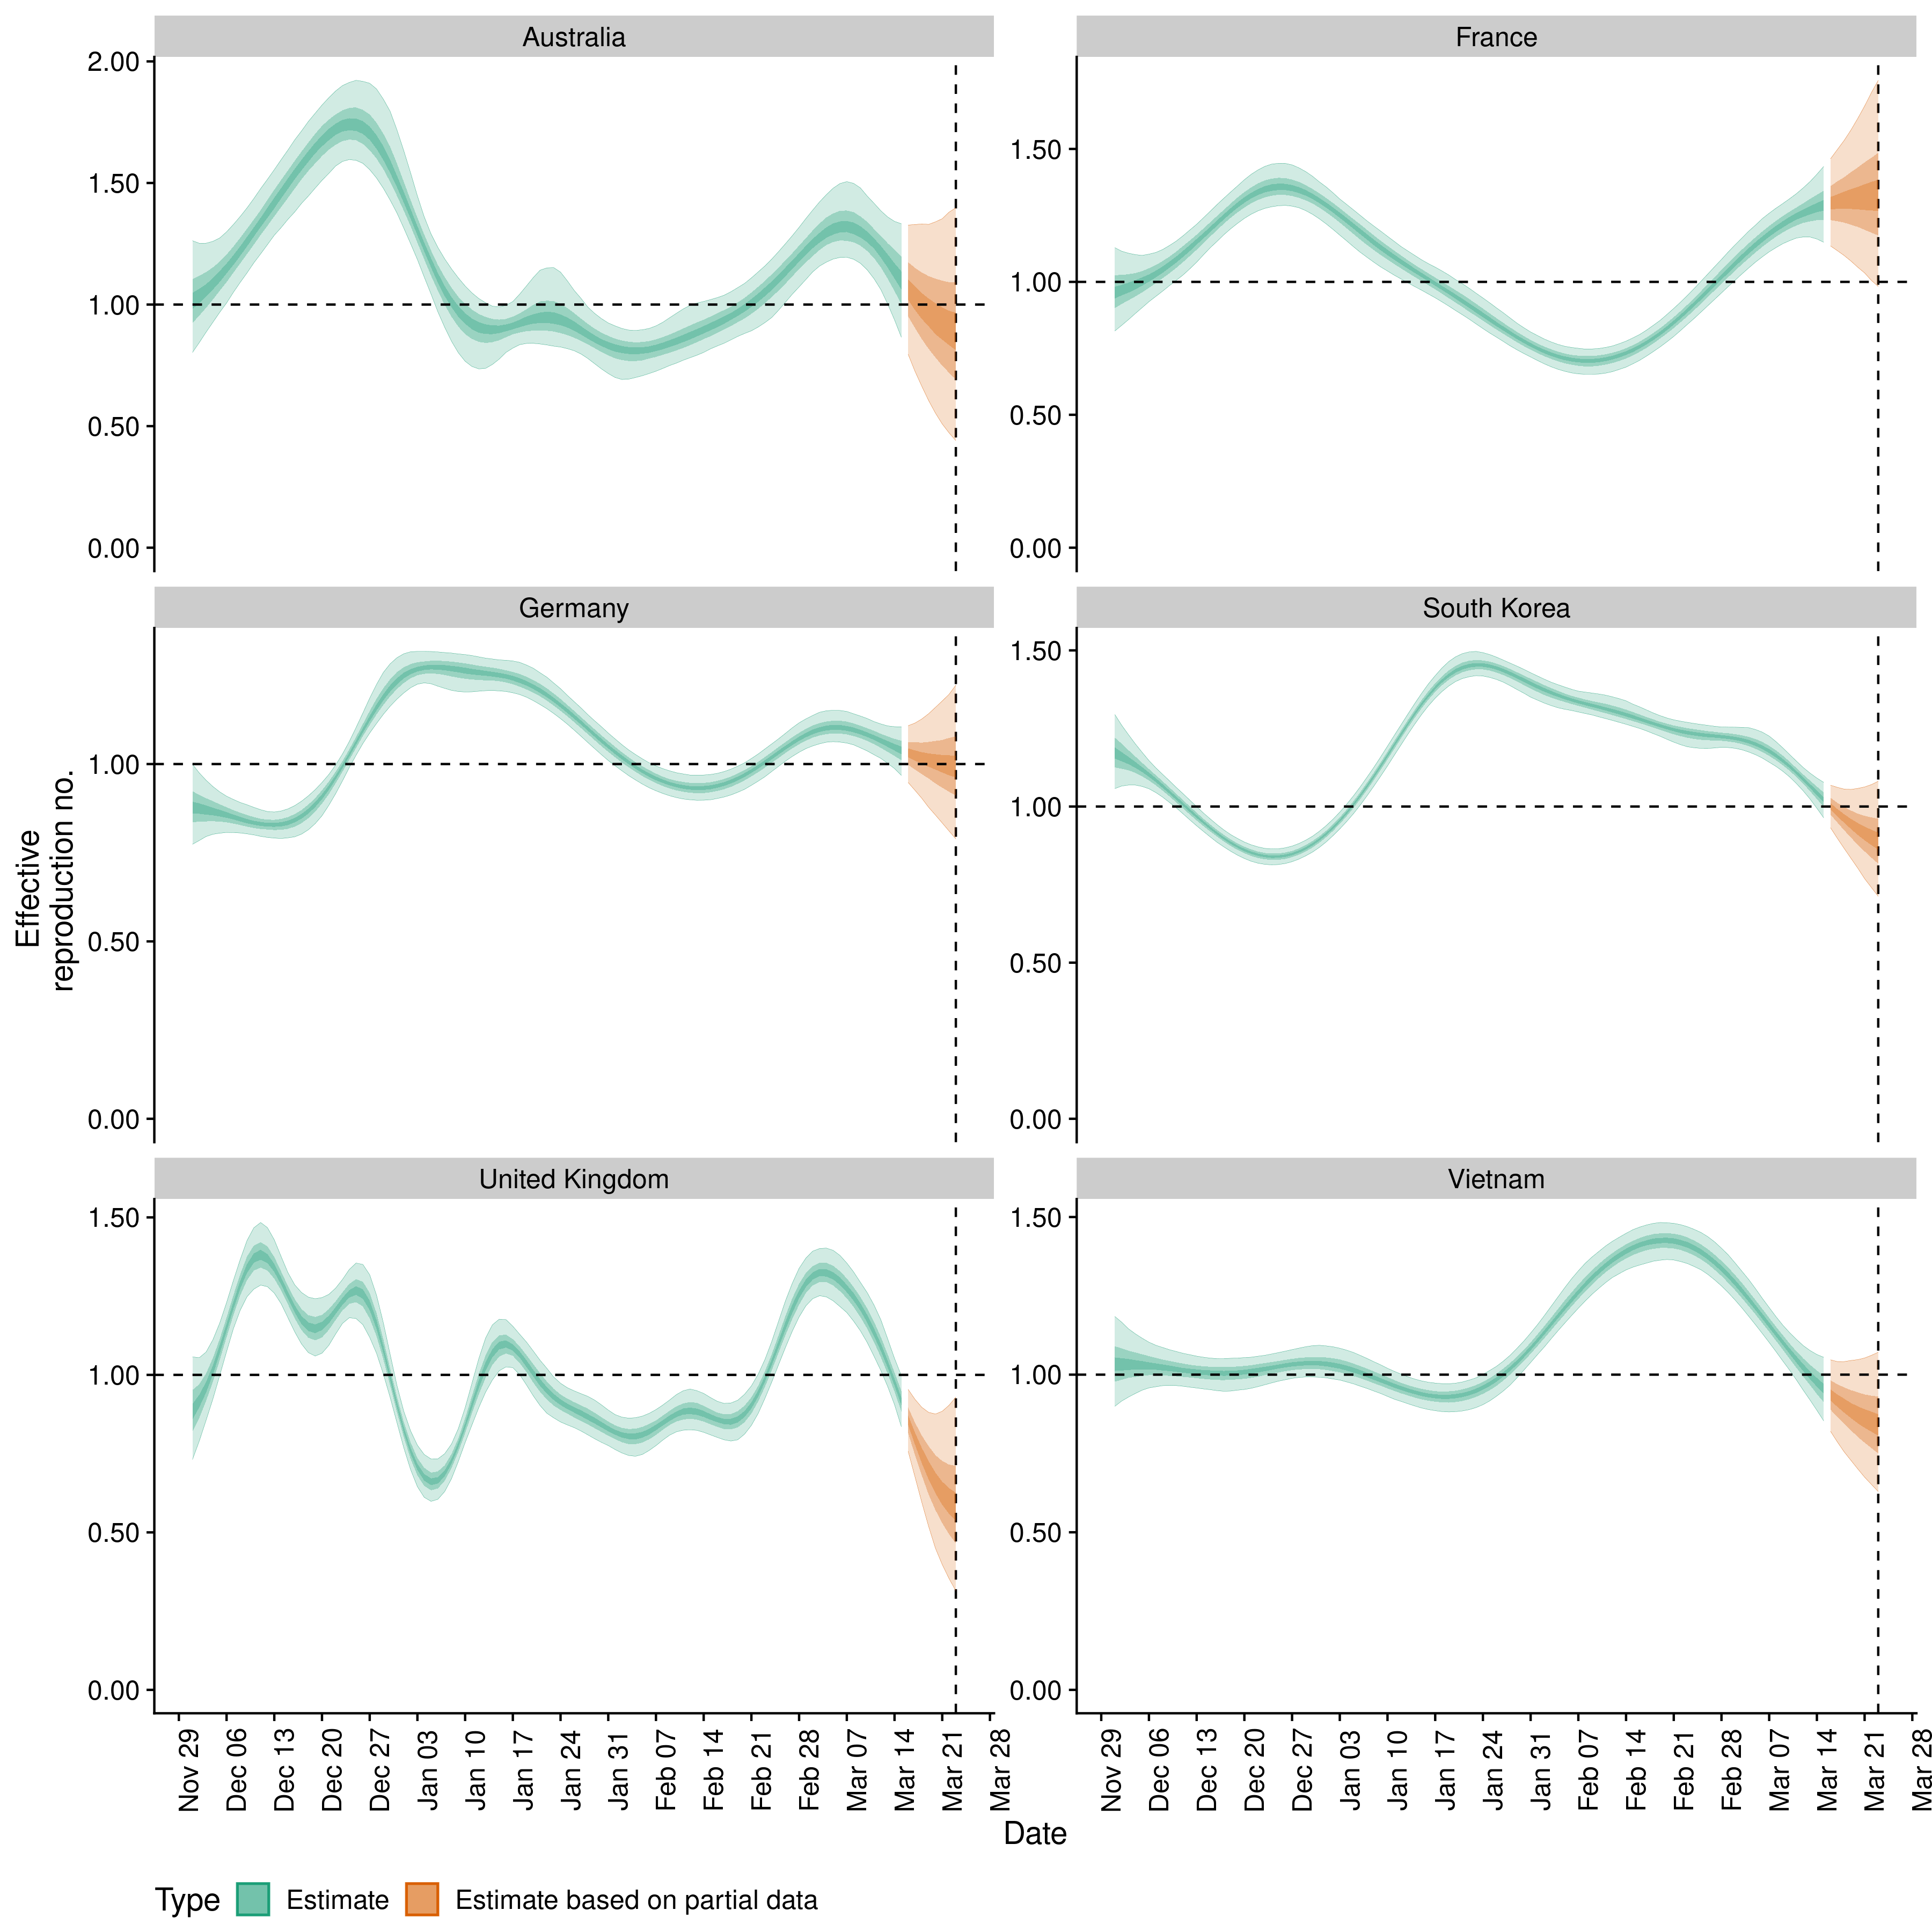
Reflections on two years estimating effective reproduction numbers
Over the last two years we have estimated reproduction numbers daily for several thousand locations, presented these estimates as a curated data set and visualised them at epiforecasts.io/covid. In this post we reflect on this project, summarising its utility, its integration with other projects, unanticipated challenges, and finally whether we would do it again.
Moving from Blogdown to Distill
A short note to state the obvious point that I have switched from using Blogdown to Distill with postcards.