class: center, middle, inverse, title-slide # Introduction to getTBinR ## Explore WHO Tuberculosis data using R ### Sam Abbott ### 2018/03/06 --- # Aims 1. Introduce [getTBinR](https://www.samabbott.co.uk/getTBinR/) 1. Explore package functionality 1. Look at package structure 1. Outreach 1. Planned functionality 1. Wrap up and analysis ideas --- class: center, middle, inverse # Background --- # Motivation - Attended Epidemics at which there were many great R packages being presented, this made me very jealous! - All my analytical work is wrapped in R packages so this gave me the tools I needed to quickly make a package. - Working on the WHO TB data for several projects I found myself constantly downloading it and cleaning it. - Started developing some tools to make this process quicker, along the way I realised more people might find the package useful. - getTBinR is born! --- # World Health Organisation TB data The WHO provide multiple cleaned datasets via their website. They also have a backend API through which other datasets can be accessed, although these tend to be far from tidy. All analysis ready datasets come with a complete data dictionary. 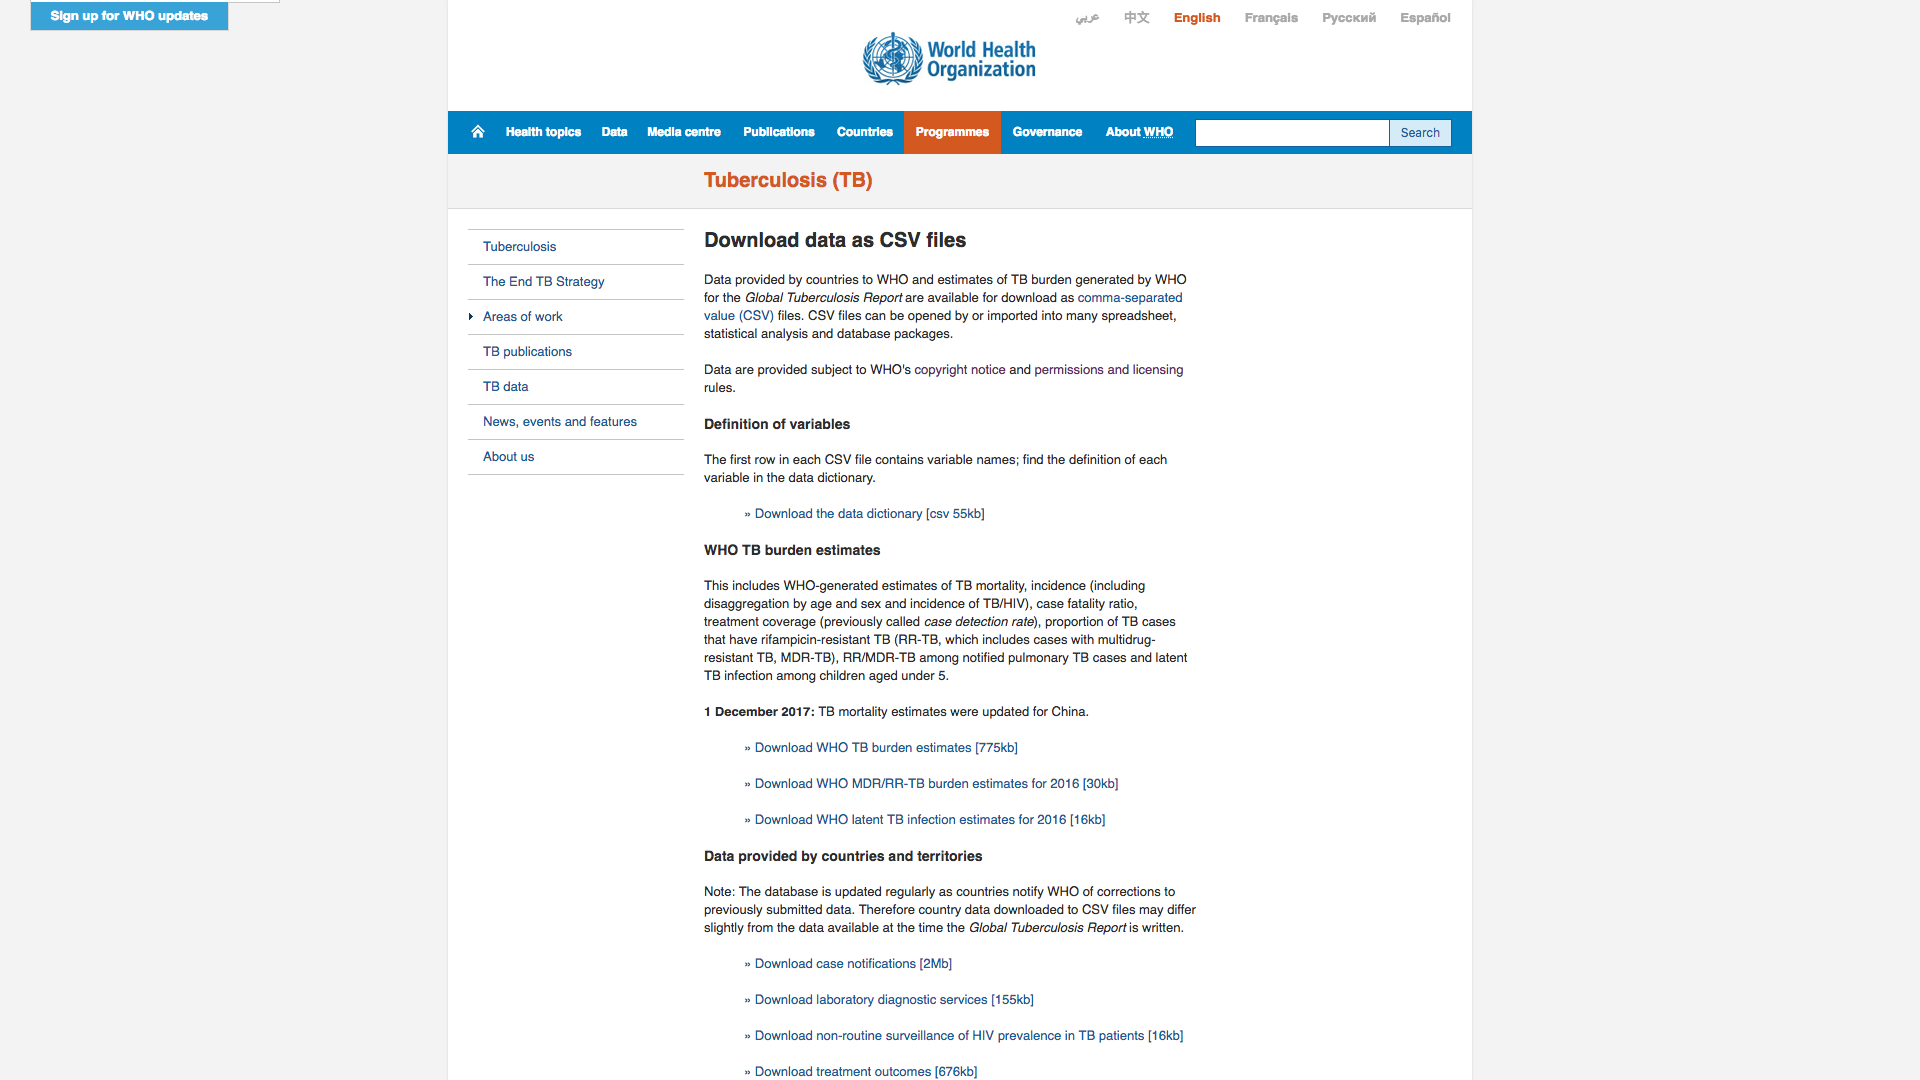<!-- --> --- class: center, middle, inverse # Set-up --- # Install the package CRAN version: ```r install.packages("getTBinR") ``` Alternatively install the GitHub development version: ```r install.packages("devtools") devtools::install_github("seabbs/getTBinR") ``` --- # Packages for this presentation This presentation makes use of the [tidyverse](https://www.tidyverse.org/), and [knitr](https://yihui.name/knitr/). It was built using [xaringan](https://github.com/yihui/xaringan). ```r library(getTBinR) #install.packages("tidyverse") library(tidyverse) #install.packages("knitr") library(knitr) ``` --- # Getting the WHO TB burden data Get the WHO TB burden data. ```r tb_burden <- getTBinR::get_tb_burden() ``` ``` ## Downloading data from: https://extranet.who.int/tme/generateCSV.asp?ds=estimates ``` ``` ## Saving data to: /tmp/RtmpJgWBcF/TB_burden.rds ``` Inspect the dimensions. ```r dim(tb_burden) ``` ``` ## [1] 3651 71 ``` --- # Getting the WHO TB burden data Inspect variables. ```r names(tb_burden) ``` ``` ## [1] "country" "iso2" ## [3] "iso3" "iso_numeric" ## [5] "g_whoregion" "year" ## [7] "e_pop_num" "e_inc_100k" ## [9] "e_inc_100k_lo" "e_inc_100k_hi" ## [11] "e_inc_num" "e_inc_num_lo" ## [13] "e_inc_num_hi" "e_inc_num_f014" ## [15] "e_inc_num_f014_lo" "e_inc_num_f014_hi" ## [17] "e_inc_num_f15plus" "e_inc_num_f15plus_lo" ## [19] "e_inc_num_f15plus_hi" "e_inc_num_f" ## [21] "e_inc_num_f_lo" "e_inc_num_f_hi" ## [23] "e_inc_num_m014" "e_inc_num_m014_lo" ## [25] "e_inc_num_m014_hi" "e_inc_num_m15plus" ## [27] "e_inc_num_m15plus_lo" "e_inc_num_m15plus_hi" ## [29] "e_inc_num_m" "e_inc_num_m_lo" ## [31] "e_inc_num_m_hi" "e_inc_num_014" ## [33] "e_inc_num_014_lo" "e_inc_num_014_hi" ## [35] "e_inc_num_15plus" "e_inc_num_15plus_lo" ## [37] "e_inc_num_15plus_hi" "e_tbhiv_prct" ## [39] "e_tbhiv_prct_lo" "e_tbhiv_prct_hi" ## [41] "e_inc_tbhiv_100k" "e_inc_tbhiv_100k_lo" ## [43] "e_inc_tbhiv_100k_hi" "e_inc_tbhiv_num" ## [45] "e_inc_tbhiv_num_lo" "e_inc_tbhiv_num_hi" ## [47] "e_mort_exc_tbhiv_100k" "e_mort_exc_tbhiv_100k_lo" ## [49] "e_mort_exc_tbhiv_100k_hi" "e_mort_exc_tbhiv_num" ## [51] "e_mort_exc_tbhiv_num_lo" "e_mort_exc_tbhiv_num_hi" ## [53] "e_mort_tbhiv_100k" "e_mort_tbhiv_100k_lo" ## [55] "e_mort_tbhiv_100k_hi" "e_mort_tbhiv_num" ## [57] "e_mort_tbhiv_num_lo" "e_mort_tbhiv_num_hi" ## [59] "e_mort_100k" "e_mort_100k_lo" ## [61] "e_mort_100k_hi" "e_mort_num" ## [63] "e_mort_num_lo" "e_mort_num_hi" ## [65] "cfr" "cfr_lo" ## [67] "cfr_hi" "c_newinc_100k" ## [69] "c_cdr" "c_cdr_lo" ## [71] "c_cdr_hi" ``` --- # Getting the WHO TB data dictionary Get the WHO TB data dictionary. ```r tb_dict <- getTBinR::get_data_dict() ``` ``` ## Downloading data from: https://extranet.who.int/tme/generateCSV.asp?ds=dictionary ``` ``` ## Saving data to: /tmp/RtmpJgWBcF/TB_data_dict.rds ``` Inspect the dimensions. ```r dim(tb_dict) ``` ``` ## [1] 402 4 ``` Inspect variables. ```r names(tb_dict) ``` ``` ## [1] "variable_name" "dataset" "code_list" "definition" ``` --- class: center, middle, inverse # Exploring getTBinR functionality --- # Search for a variable ```r vars_of_interest <- getTBinR::search_data_dict(var = c("e_inc_100k"), def = "incidence") ``` ``` ## Loading data from: /tmp/RtmpJgWBcF/TB_data_dict.rds ``` ``` ## 1 results found for your variable search for e_inc_100k ``` ``` ## 12 results found for your definition search for incidence ``` --- # Search Result ```r kable(vars_of_interest, "html") ``` <table> <thead> <tr> <th style="text-align:left;"> variable_name </th> <th style="text-align:left;"> dataset </th> <th style="text-align:left;"> code_list </th> <th style="text-align:left;"> definition </th> </tr> </thead> <tbody> <tr> <td style="text-align:left;"> e_inc_100k </td> <td style="text-align:left;"> Estimates </td> <td style="text-align:left;"> </td> <td style="text-align:left;"> Estimated incidence (all forms) per 100 000 population </td> </tr> <tr> <td style="text-align:left;"> e_inc_100k_hi </td> <td style="text-align:left;"> Estimates </td> <td style="text-align:left;"> </td> <td style="text-align:left;"> Estimated incidence (all forms) per 100 000 population, high bound </td> </tr> <tr> <td style="text-align:left;"> e_inc_100k_lo </td> <td style="text-align:left;"> Estimates </td> <td style="text-align:left;"> </td> <td style="text-align:left;"> Estimated incidence (all forms) per 100 000 population, low bound </td> </tr> <tr> <td style="text-align:left;"> e_inc_rr_num </td> <td style="text-align:left;"> Estimates </td> <td style="text-align:left;"> </td> <td style="text-align:left;"> Estimated incidence of rifampicin resistant TB (absolute number) </td> </tr> <tr> <td style="text-align:left;"> e_inc_rr_num_hi </td> <td style="text-align:left;"> Estimates </td> <td style="text-align:left;"> </td> <td style="text-align:left;"> Estimated incidence of rifampicin resistant TB (absolute number): high bound </td> </tr> <tr> <td style="text-align:left;"> e_inc_rr_num_lo </td> <td style="text-align:left;"> Estimates </td> <td style="text-align:left;"> </td> <td style="text-align:left;"> Estimated incidence of rifampicin resistant TB (absolute number): low bound </td> </tr> <tr> <td style="text-align:left;"> e_inc_tbhiv_100k </td> <td style="text-align:left;"> Estimates </td> <td style="text-align:left;"> </td> <td style="text-align:left;"> Estimated incidence of TB cases who are HIV-positive per 100 000 population </td> </tr> <tr> <td style="text-align:left;"> e_inc_tbhiv_100k_hi </td> <td style="text-align:left;"> Estimates </td> <td style="text-align:left;"> </td> <td style="text-align:left;"> Estimated incidence of TB cases who are HIV-positive per 100 000 population, high bound </td> </tr> <tr> <td style="text-align:left;"> e_inc_tbhiv_100k_lo </td> <td style="text-align:left;"> Estimates </td> <td style="text-align:left;"> </td> <td style="text-align:left;"> Estimated incidence of TB cases who are HIV-positive per 100 000 population, low bound </td> </tr> <tr> <td style="text-align:left;"> e_inc_tbhiv_num </td> <td style="text-align:left;"> Estimates </td> <td style="text-align:left;"> </td> <td style="text-align:left;"> Estimated incidence of TB cases who are HIV-positive </td> </tr> <tr> <td style="text-align:left;"> e_inc_tbhiv_num_hi </td> <td style="text-align:left;"> Estimates </td> <td style="text-align:left;"> </td> <td style="text-align:left;"> Estimated incidence of TB cases who are HIV-positive, high bound </td> </tr> <tr> <td style="text-align:left;"> e_inc_tbhiv_num_lo </td> <td style="text-align:left;"> Estimates </td> <td style="text-align:left;"> </td> <td style="text-align:left;"> Estimated incidence of TB cases who are HIV-positive, low bound </td> </tr> </tbody> </table> --- # Map Global Incidence Rates ```r getTBinR::map_tb_burden(metric = "e_inc_100k", verbose = FALSE, interactive = FALSE) ``` <!-- --> --- # Get 10 countries with highest incidence rates in 2016 ```r high_inc_countries <- tb_burden %>% filter(year == 2016) %>% group_by(country) %>% summarise(e_inc_100k = max(e_inc_100k)) %>% ungroup %>% arrange(desc(e_inc_100k)) %>% slice(1:10) %>% pull(country) %>% unique ``` --- # 10 countries with highest incidence rates in 2016 ```r high_inc_countries ``` ``` ## [1] "South Africa" ## [2] "Lesotho" ## [3] "Kiribati" ## [4] "Philippines" ## [5] "Mozambique" ## [6] "Democratic People's Republic of Korea" ## [7] "Timor-Leste" ## [8] "Gabon" ## [9] "Namibia" ## [10] "Papua New Guinea" ``` --- # Overview of TB incidence rates For the countries with the 10 highest incidence rates ```r getTBinR::plot_tb_burden_overview(metric = "e_inc_100k", countries = high_inc_countries, verbose = FALSE) ``` <!-- --> --- # Trends over time in TB incidence rates For the countries with the 10 highest incidence rates ```r plot_tb_burden(metric = "e_inc_100k", countries = high_inc_countries, facet = "country", scales = "free_y", verbose = FALSE) ``` <!-- --> --- # For non R users getTBinR has a built in `shiny` dashboard which can be run locally using `getTBinR::run_tb_dashboard()`. Alternatively there is a [hosted version](http://www.seabbs.co.uk/shiny/ExploreGlobalTB/). 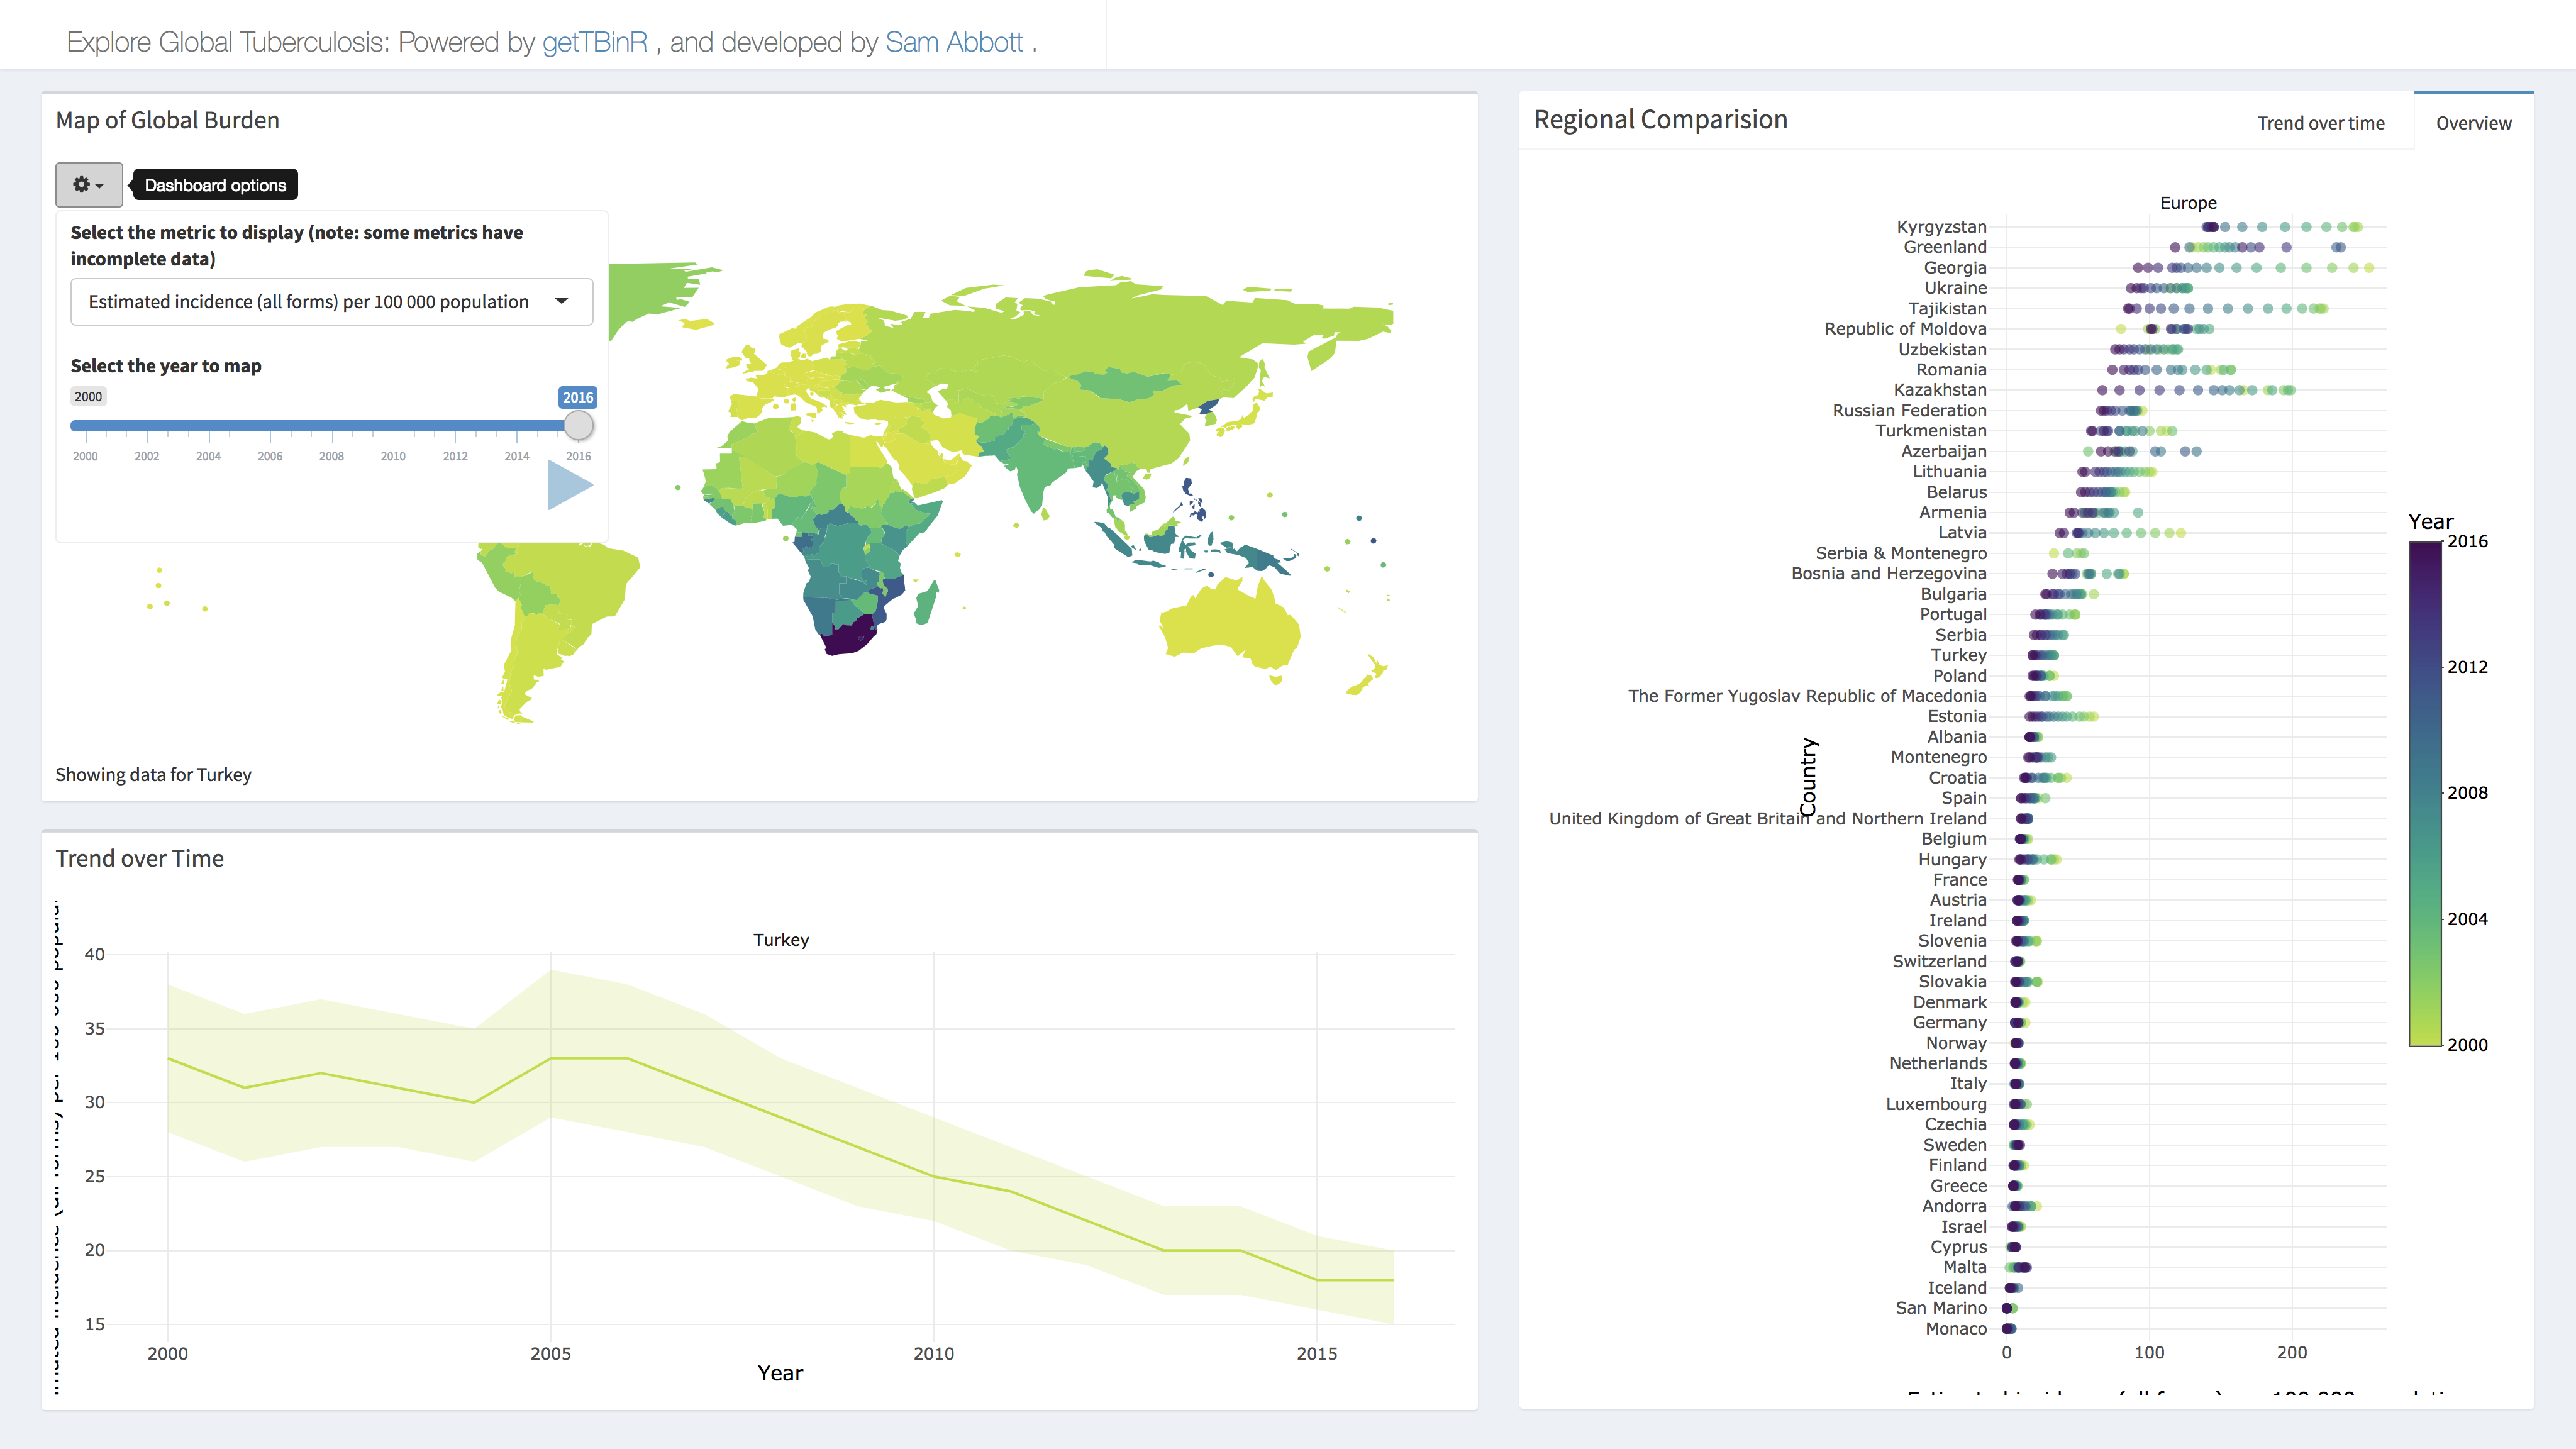<!-- --> --- class: center, middle, inverse # Package Structure --- # Documentation Documentation is built using `roxygen`, this is then used to generate a package website using `pkgdown`. See [here](https://github.com/seabbs/getTBinR/blob/master/_pkgdown.yml) for the yaml and [here](https://www.samabbott.co.uk/getTBinR/index.html) for the site. 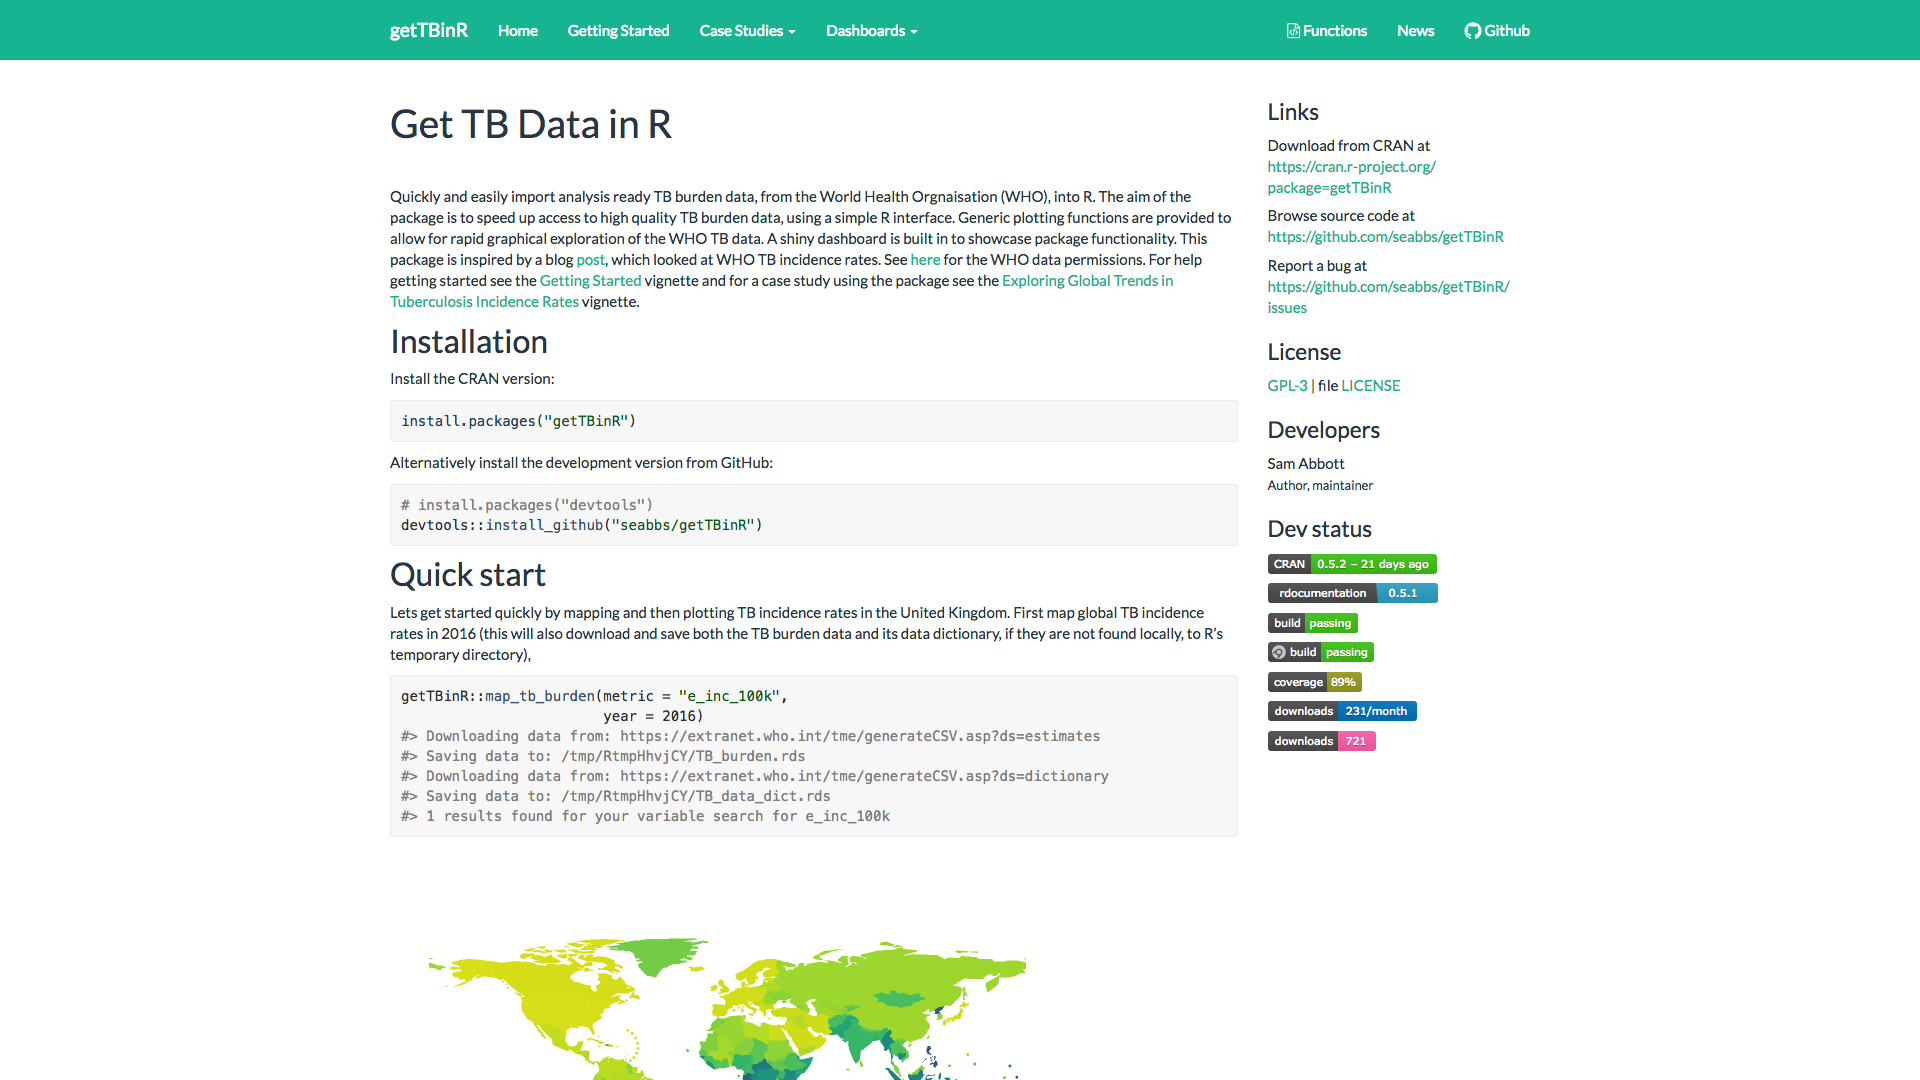<!-- --> --- # Testing - Unit tests are implemented using the `testthat` package. - The package is then tested on Linux and Mac using [Travis](https://travis-ci.com/), and on Windows using [AppVeyor](https://ci.appveyor.com/login). See [here](https://github.com/seabbs/getTBinR/tree/master/tests/testthat) for tests, [here](https://github.com/seabbs/getTBinR/blob/master/.travis.yml) for travis set-up , and [here] for [here](https://github.com/seabbs/getTBinR/blob/master/appveyor.yml) Appveyor set-up. - Code coverage is then checked using [Codecov](https://codecov.io/github/seabbs/getTBinR?branch=master). Example test: ```r test_that("TB burden data is the same when downloaded using utils::read.csv", { tb_data_utils <- get_tb_burden(download_data = TRUE, use_utils = TRUE, burden_save_name = "TB_with_utils") skip_on_cran() expect_equal(tb_data, tb_data_utils) }) ``` --- class: center, middle, inverse # Outreach --- # Blog posts I have written several blog posts which have then be editted into vignettes, see [here](https://www.samabbott.co.uk/tags/who/) <!-- --> --- # Gists and Tweets Gists [here](https://gist.github.com/seabbs) and twitter [here](https://twitter.com/seabbs). 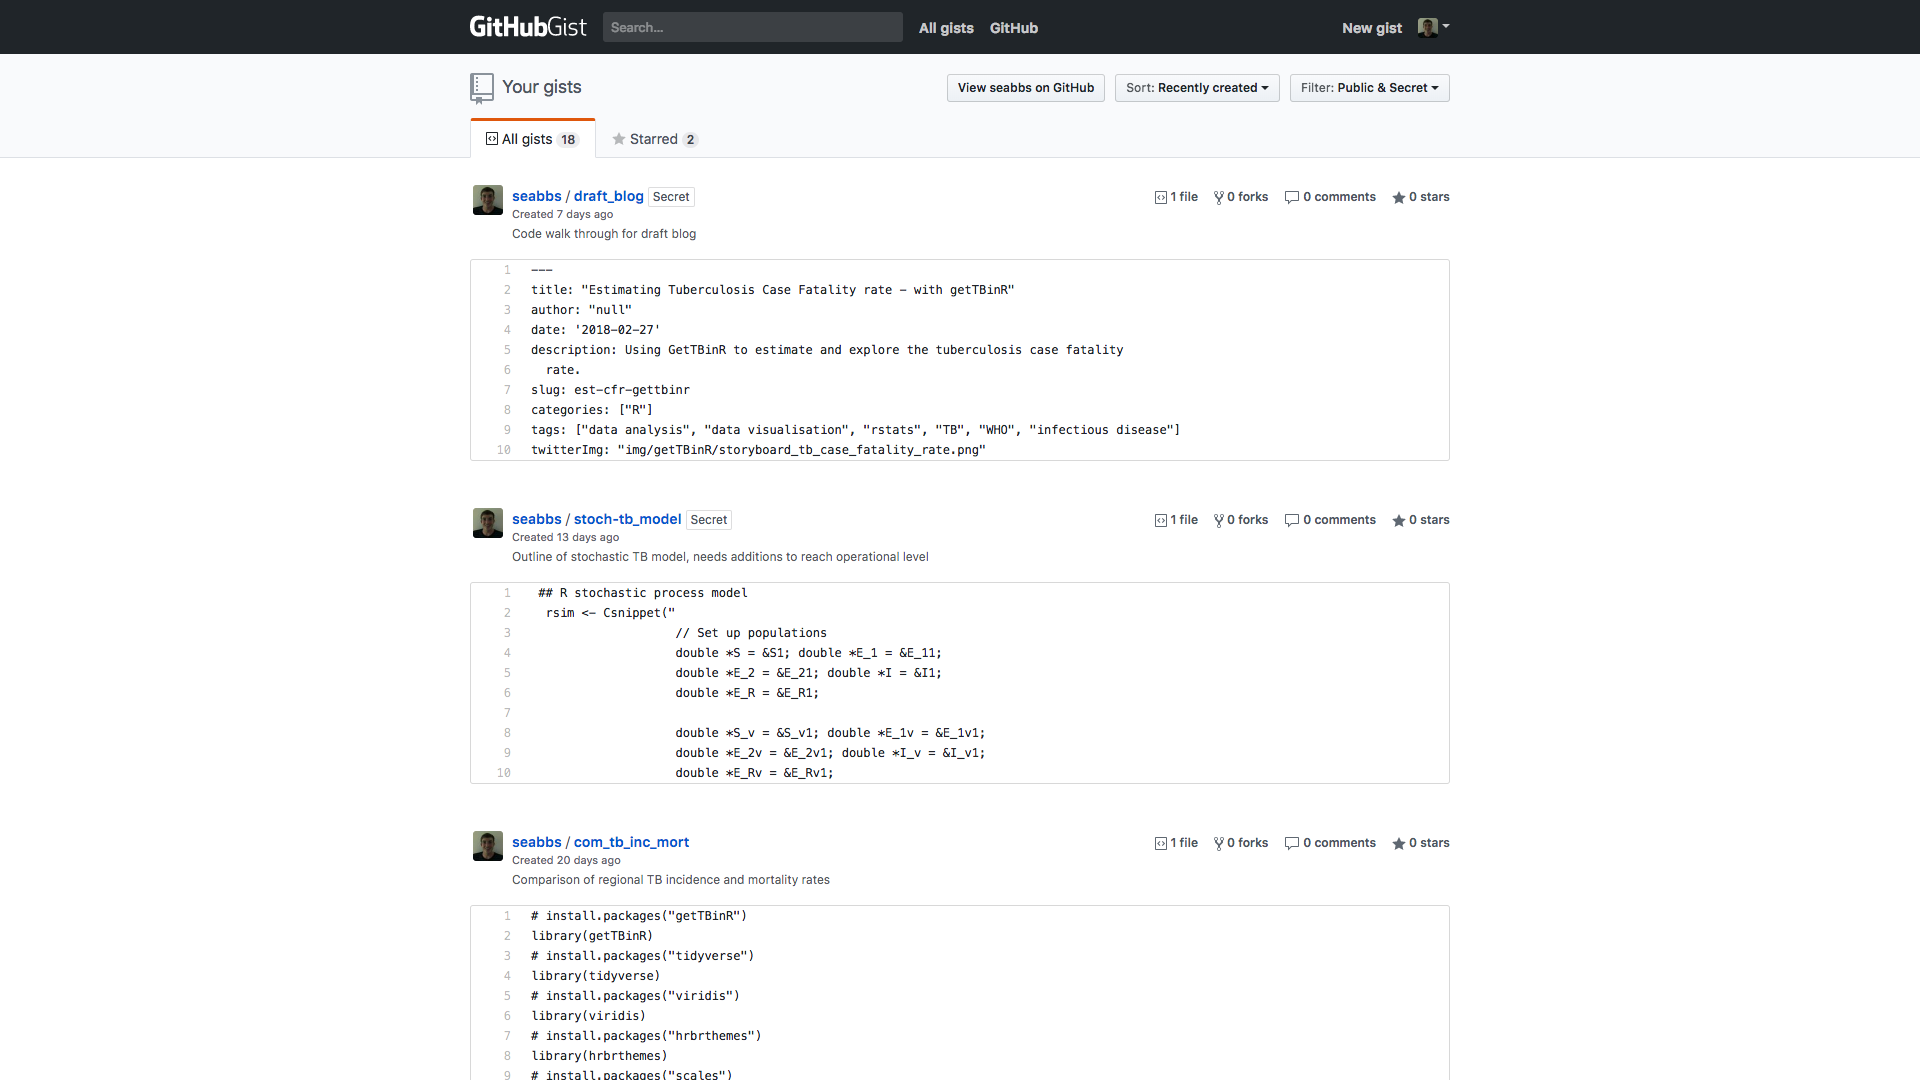<!-- --> --- class: center, middle, inverse # Planned Funtionality --- # Issues Currently planned functionality has been outlined in the GitHub issues, found [here](https://github.com/seabbs/getTBinR/issues). <!-- --> --- class: center, middle, inverse # Wrap up --- # Wrap up Hopefully you enjoyed your whistle stop tour of `getTBinR` and R package construction. I'm interested in your ideas of what can be done with this data. An example; - Multilevel model to explore country level contributions to incidence rates. ---