Map measures of TB burden by country by specifying a metric from the TB burden data. Specify a country or vector of countries in order to map them (the default is to map all countries). Various other options are available for tuning the plot further.
map_tb_burden(
  df = NULL,
  dict = NULL,
  metric = "e_inc_100k",
  metric_label = NULL,
  fill_var_type = NULL,
  countries = NULL,
  compare_to_region = FALSE,
  facet = NULL,
  legend = "bottom",
  year = NULL,
  annual_change = FALSE,
  trans = "identity",
  interactive = FALSE,
  download_data = TRUE,
  save = TRUE,
  viridis_palette = "viridis",
  viridis_direction = -1,
  viridis_end = 0.9,
  verbose = FALSE,
  ...
)
Arguments
| df | Dataframe of TB burden data, as sourced by |
|---|---|
| dict | A tibble of the data dictionary. See |
| metric | Character string specifying the metric to plot |
| metric_label | Character string specifying the metric label to use. |
| fill_var_type | A character string, defaults to |
| countries | A character string specifying the countries to target. |
| compare_to_region | Logical, defaults to |
| facet | Character string, the name of the variable to facet by. |
| legend | Character string, defaults to |
| year | Numeric, indicating the year of data to map. Defaults to the latest year in the data.
If |
| annual_change | Logical, defaults to |
| trans | A character string specifying the transform to use on the specified metric. Defaults to no
transform ("identity"). Other options include log scaling ("log") and log base 10 scaling
("log10"). For a complete list of options see |
| interactive | Logical, defaults to |
| download_data | Logical, defaults to |
| save | Logical, should the data be saved for reuse during the current R session. Defaults to
|
| viridis_palette | Character string indicating the |
| viridis_direction | Numeric, indicating the direction for the colour palette (1 or -1), defaults to -1.
See |
| viridis_end | Numeric between 0 and 1, defaults to 0.9. The end point of the viridis scale to use.
#' See |
| verbose | Logical, defaults to |
| ... | Additional arguments to pass to |
Value
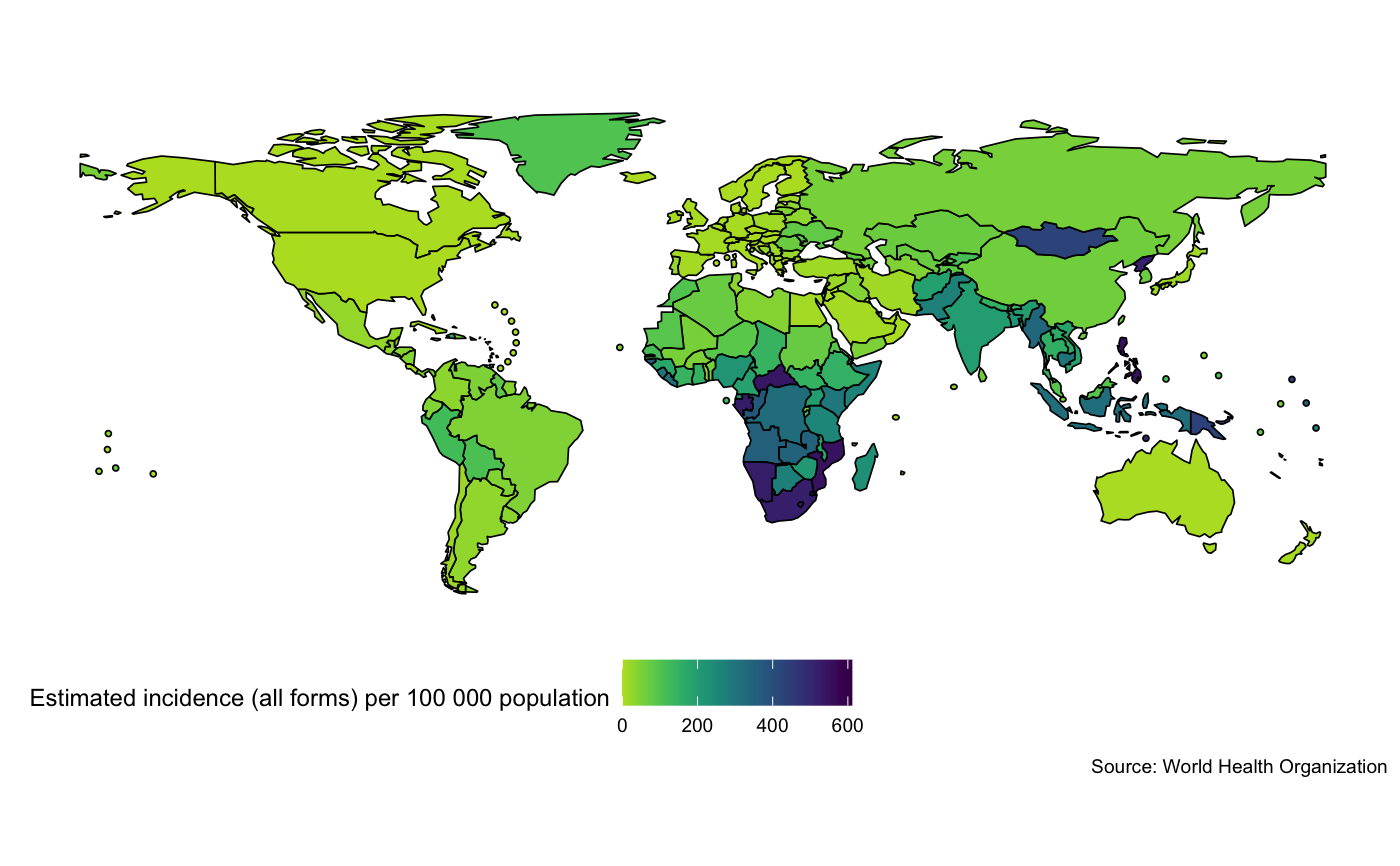
A plot of TB Incidence Rates by Country
See also
plot_tb_burden plot_tb_burden_overview get_tb_burden search_data_dict
Examples
## Map raw incidence rates
map_tb_burden()if (FALSE) {
#' ## Map raw incidence rates
map_tb_burden(year = 2014:2017, facet = "year")

## Map log10 scaled incidence rates
map_tb_burden(trans = "log10")

## Map percentage annual change in incidence rates
map_tb_burden(annual_change = TRUE)

## Find variables relating to mortality in the WHO dataset
search_data_dict(def = "mortality")

## Map mortality rates (exc HIV) - without progress messages
map_tb_burden(metric = "e_mort_exc_tbhiv_100k", verbose = FALSE)

## Can also use a discrete metric if one is available
map_tb_burden(metric = "g_whoregion", metric_label = "WHO world region")
}