Plot Summaries of TB Burden - By Region, Globally and for Custom Groups
Source:R/plot_tb_burden_summary.R
plot_tb_burden_summary.RdPlot summaries of TB burden metrics by region, globally, and for custom groupings. For variables with uncertainty represented by confidence intervals bootstrapping can be used (assuming a normal distribution) to include this in any estimated summary measures. Currently four statistics are supported; the mean (with 95\
plot_tb_burden_summary(
  df = NULL,
  dict = NULL,
  metric = "e_inc_num",
  metric_label = NULL,
  conf = c("_lo", "_hi"),
  years = NULL,
  samples = 1000,
  countries = NULL,
  compare_to_region = FALSE,
  compare_to_world = TRUE,
  custom_compare = NULL,
  compare_all_regions = TRUE,
  stat = "rate",
  denom = "e_pop_num",
  rate_scale = 1e+05,
  truncate_at_zero = TRUE,
  annual_change = FALSE,
  smooth = FALSE,
  facet = NULL,
  legend = "bottom",
  trans = "identity",
  scales = "fixed",
  interactive = FALSE,
  viridis_palette = "viridis",
  viridis_direction = -1,
  viridis_end = 0.9,
  download_data = TRUE,
  save = TRUE,
  verbose = FALSE,
  ...
)
Arguments
| df | Dataframe of TB burden data, as sourced by |
|---|---|
| dict | A tibble of the data dictionary. See |
| metric | Character string specifying the metric to plot |
| metric_label | Character string defaulting to |
| conf | Character vector specifying the name variations to use to specify the upper
and lower confidence intervals. Defaults to c("_lo", "_hi"), if set to |
| years | Numeric vector of years. Defaults to |
| samples | Numeric, the number of samples to use to generate confidence
intervals (only used when |
| countries | A character string specifying the countries to target. |
| compare_to_region | Logical, defaults to |
| compare_to_world | Logical, defaults to |
| custom_compare | Logical, defaults to |
| compare_all_regions | Logical, defaults to |
| stat | Character string, defaults to |
| denom | Character string defaulting to |
| rate_scale | Numeric defaults to 100,000. The scaling to use for rates. If |
| truncate_at_zero | Logical, defaults to |
| annual_change | Logical, defaults to |
| smooth | Logical, defaults to |
| facet | Character string, the name of the variable to facet by. |
| legend | Character string, defaults to |
| trans | A character string specifying the transform to use on the specified metric. Defaults to no
transform ("identity"). Other options include log scaling ("log") and log base 10 scaling
("log10"). For a complete list of options see |
| scales | Character string, see ?ggplot2::facet_wrap for details. Defaults to "fixed", alternatives are "free_y", "free_x", or "free". |
| interactive | Logical, defaults to |
| viridis_palette | Character string indicating the |
| viridis_direction | Numeric, indicating the direction for the colour palette (1 or -1), defaults to -1.
See |
| viridis_end | Numeric between 0 and 1, defaults to 0.9. The end point of the viridis scale to use.
#' See |
| download_data | Logical, defaults to |
| save | Logical, should the data be saved for reuse during the current R session. Defaults to
|
| verbose | Logical, defaults to |
| ... | Additional arguments to pass to |
Value
A plot of TB Incidence Rates by Country
See also
search_data_dict plot_tb_burden summarise_tb_burden
summarise_tb_burden get_tb_burden search_data_dict
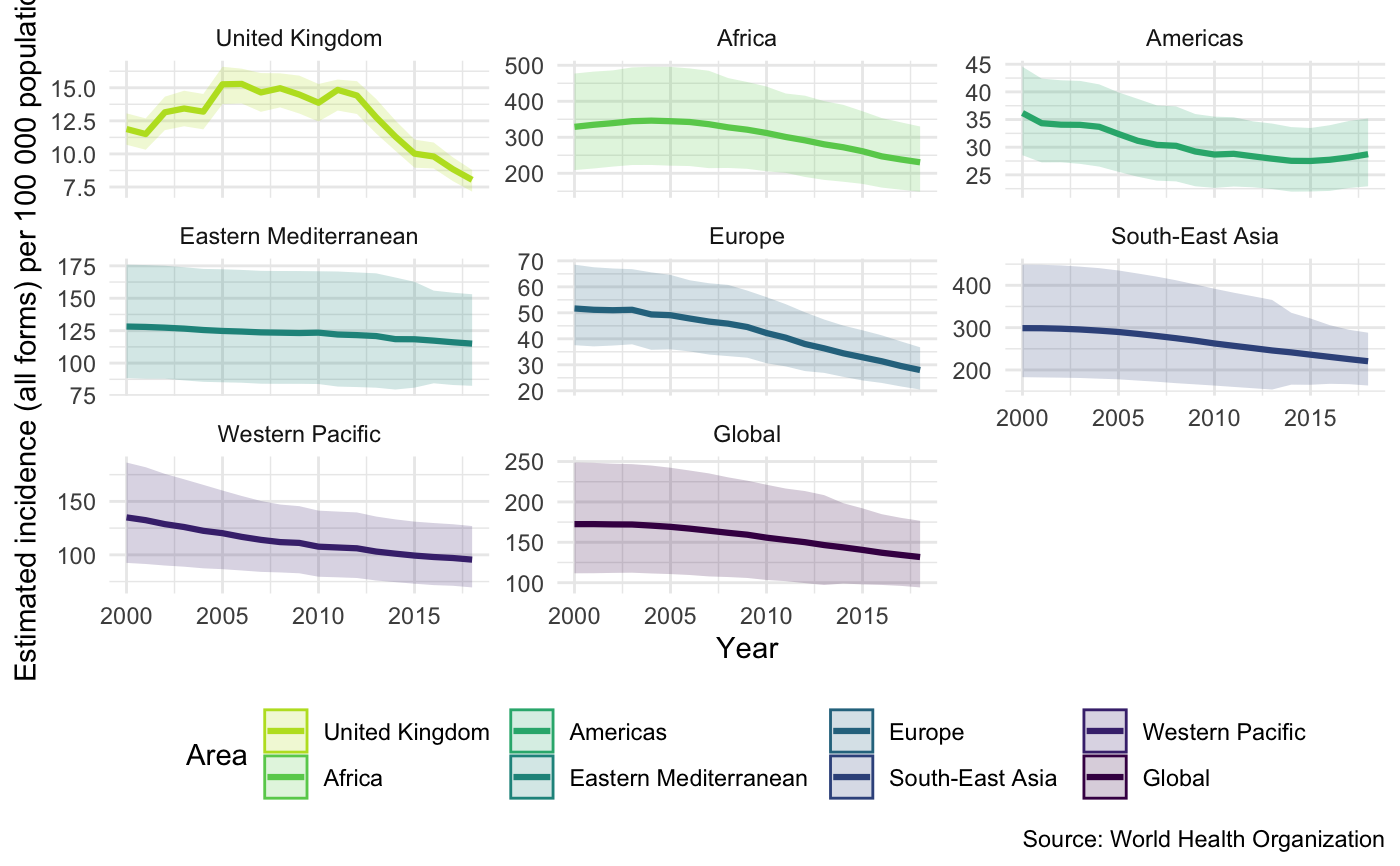
Examples
## Get an overview of incidence rates regionally and globally compared to the UK
plot_tb_burden_summary(
  metric = "e_inc_num",
  metric_label = "e_inc_100k",
  stat = "rate",
  countries = "United Kingdom",
  compare_to_world = TRUE,
  compare_all_regions = TRUE,
  verbose = FALSE,
  scales = "free_y",
  facet = "Area"
)if (FALSE) {


## Get summary data for the UK, Europe and the world
## Bootstrapping CI's
plot_tb_burden_summary(
  metric = "e_inc_num",
  samples = 100,
  stat = "mean",
  countries = "United Kingdom",
  compare_to_world = TRUE,
  compare_to_region = TRUE,
  verbose = FALSE,
  facet = "Area",
  scales = "free_y"
)
}